Your Vote is Your Voice: Drink Up!
Well, folks, it’s officially November and this tumultuous year is beginning to come to a close, but not before the big (YUGE?) cataclysmic event of Election Day, held on Tuesday, November 3rd. 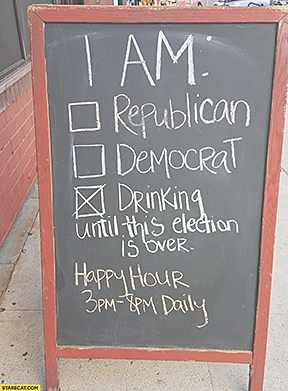 Democrat, Republican, Green, Independent, Libertarian, Liberal, Conservative, Moderate, Right, Left, Middle – whatever your political preference, the one thing that I believe most of us can agree on is the need to imbibe during and definitely after this election season is complete. However, the question remains: Can we agree on WHAT to drink according to our political preferences?
Surprisingly, there have actually been studies done over the last few election cycles to figure out what people prefer to drink based on one’s political orientation. Scarborough Research gathered consumer information in 2012 and gave it to National Media Research Planning and Placement, an Alexandria, VA-based Republican consulting firm where all the data was analyzed. They created a graph that depicts voter turnout from low to high on the vertical Y-axis and political party skew from Democrat to Republican on the horizontal X-axis. Major-label beer companies, along with a few specific styles of wine and liquor, are the bubbles graphed along the axes, with small bubbles indicating a smaller percentage of the data population and large bubbles indicating a larger percentage.
After analyzing all the data, with regard to beer, it’s interesting to note that Democrats tend to enjoy non-domestic brews like Guinness, Stella Artois, Heineken, and Dos Equis, while Republicans tend to enjoy their American-made brews such as Miller, Coors, Michelob, and Samuel Adams. Bud Light is the one beer equally favored amongst both parties per the graph, and it’s also notable to find that Democrats make up the majority of “any microbrew” drinkers, and they also tend to be people who show up and vote at the polls!
Then, in 2013, GFK MRI – a consumer data group – collected further specific research and sent it to the same consulting firm, where they analyzed all the gathered data to form the same graph that depicts voter turnout from low to high on the vertical Y-axis and political party skew from Democrat to Republican on the horizontal X-axis. This time, only wine and liquor brands (no beer) were the bubbles graphed along the axes, with small bubbles indicating a smaller percentage of the weighted population and large bubbles indicating a larger percentage.
The results indicated that Democrats tend to choose clear liquors – Absolut, Grey Goose, and Three Olives, while Republicans went all-in on the brown liquor choosing to drink the likes of Jim Beam, Jack Daniel’s, and Wild Turkey. The wine went both ways, but it’s clear that specific brands/producers in the wine industry have different consumers based on political preferences: Francis Coppola and Sutter Home for Democrats while Republicans drank Kendall-Jackson and Robert Mondavi. It’s also interesting to note that when it comes to both political parties if you drink wine, you’re the MOST likely to show up and vote in an election versus those drinking flavored vodka beverages and whiskey, as they tended to not vote at all. As an aside, this was also the case with the prior 2012 analyzed data – wine drinkers were much more likely to vote versus beer drinkers.
There are also some gems in there too, such as Democrats favor Peach Schnapps while Republicans favor Peppermint Schnapps, Democrats drink champagne while Republicans drink Franzia, and apparently, EVERYONE across both party lines loves Rum with both Captain Morgan Spiced & Bacardi being literally smack dab in the middle of the graph with sizeable bubbles!
In 2018, the National Media group updated its graph with newer data, and to be perfectly honest, not much has changed. Wine drinkers tend to be more reliable voters, Republicans enjoy their Coors and brown liquors, while Democrats continue to like Stella and vodka, and rum and Bud Light continue to reign supreme as the bipartisan drink of choice. There were a couple of interesting things to note though – Blue Moon, in 2012, was very much in Republican territory, whereas in 2018, that switched and Blue Moon resolutely stands on the Democrat side of the graph. Perhaps that was a marketing strategy? Or was it maybe something else? The second note of interest is that despite such a large jump in micro- and craft breweries around the US, this was not depicted as a bubble on the 2018 graph, which I found to be strange and being a craft beer enthusiast myself, would have like to see if we would still be considered a largely Democratic-voting body, or if the tides had turned.
I suppose while all of this research and data information is interesting, it could also be quite helpful when it comes to knowing your audience. If you need to bring a bottle of wine to an event where you know a specific grouping of people will be, or if you’re headed to a party and you need something that will please the crowd, the graphs may be useful. Otherwise, it’s probably just super helpful trivia knowledge that one might use at The Evergreen or Beer Belly Deli some random night. And above all, if there’s one thing that unites us as Americans in these ever-divided times, it’s that we love ourselves an alcoholic beverage – Cheers to that!
Sources: Washington Post and The Independent

